The short answer
Open the browser's extensions page, choose Details under the extension, and read its permissions: they show what it could reach. To see what it actually sends, you can watch its traffic in the browser's developer tools. The steps below walk you through it and take about ten minutes.
On a phone? The ClarShot steps below are for a computer: ClarShot runs in Chrome and Edge on Windows, Mac, Linux and ChromeOS.
An extension's description tells you what it promises. Its permissions tell you what it could do. Only its network traffic tells you what it actually sends. The steps below check all three, in about ten minutes, for any extension. The page names are shown for Edge; in Chrome, replace edge:// with chrome://.
1. Read its permissions
Open edge://extensions and choose Details under the extension. Look at Permissions and at Site access.
- "Read and change all your data on all websites", or a long list of sites, means it can see every page you open. Some extensions need that, for example an ad blocker. A screenshot or a notes tool usually does not.
- "On click" or no site access means it only touches the tab you are on, when you use it.
- History, cookies, tabs or other extensions are worth a question: what does it need them for?
Permissions show what an extension can reach, not what it does with it. The next steps show that.
The next steps use the browser's developer tools. They look technical, but you only click and watch a list.
2. Watch its background worker
Most extensions have a part that runs in the background, even when its window is closed. The browser calls it the service worker, and it is where data is usually sent from.
- On
edge://extensions, turn on Developer mode. - Under the extension, next to Inspect views, click service worker. DevTools opens for it.
- Choose the Network tab and turn on Keep log (Preserve log in older versions). Keep this window open: while DevTools is open, the worker does not go to sleep.
- Use the extension as you normally would, for a few minutes, and watch the list.
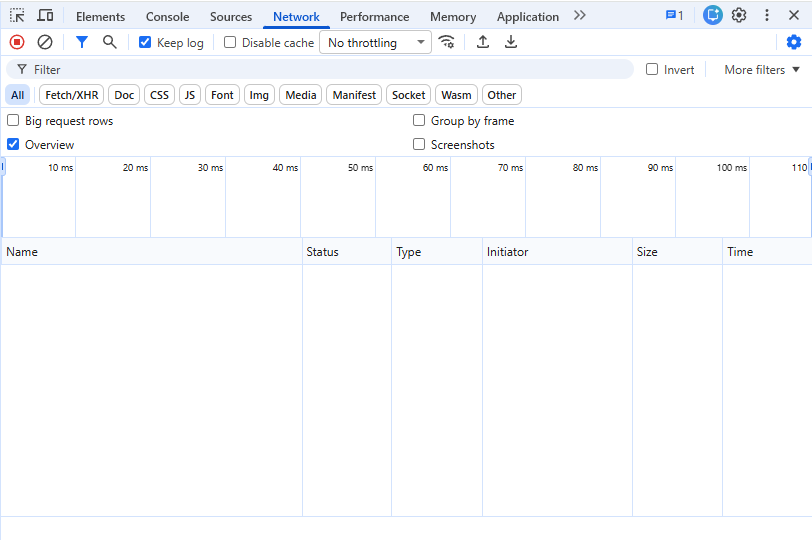
3. Watch its popup and pages
The window that opens from the toolbar icon is a separate page with its own DevTools. Open the popup, right-click inside it and choose Inspect, then watch the Network tab while you use it. Extensions that open their own pages, such as an editor or a settings page, work the same way: press F12 on that page.
4. Look at the pages you visit
Extensions with site access can run scripts inside the web pages you open. Requests those scripts make show up in the page's own DevTools: press F12 on the web page, open Network, and look at the Initiator column for entries that point to the extension rather than the site.
5. For a complete record: net-export
The browser can write down every request it makes, whatever made it. Open edge://net-export, choose Start logging to disk, use the extension, then Stop logging. The file lists every host the browser contacted in that time. It includes the sites you visited, so treat it as private and do not share it.
How to read what you find
- No requests at all is the clearest result. It is possible for tools that do their work on your device.
- Requests to the extension's own service are expected when it has an account, sync or sharing. Check that its privacy policy explains them.
- Requests to analytics or advertising hosts, or requests that carry the address of the page you are on, deserve a closer look, especially if the listing says nothing about them.
Two more places help. The Chrome Web Store shows a Privacy practices section for each extension, filled in by its developer. And extensions built on Manifest V3, the current format, may not load code from the internet, so what you inspect is what runs.
Doing this for ClarShot
ClarShot is built to pass this test. It asks for six permissions and no site access, it makes no network requests in the popup, the editor or the recorder, and it has no account, analytics or crash reporting. Our notes for IT and security reviewers list each permission and the exact steps to check it yourself. The same applies to this website: the screenshot privacy check shows a live count of the requests the page makes to other sites, read from your own browser.
Common questions
Can an extension hide its traffic from DevTools?
Requests made from its worker, its pages and its page scripts show up in the DevTools of each of those. The net-export log records everything the browser sends, which is why it is the step to use when you want to be sure.
Does an extension update itself over the network?
The browser updates store extensions itself, from the store. That traffic comes from the browser, not from the extension's code.
Vivaldi, Arc and most other browsers are built on Chrome, so the Chrome version works there too.
Add to ChromeClarShot works in Chrome and Edge on a computer, not on phones. Send yourself the link and open it there.
Related guides
- How to hide private information in a screenshot, and why blur is not enoughBlur and pixelation can be reversed. How to cover names, emails and numbers in a screenshot so nothing can be recovered, with a live demo you can try.
- How to record your screen with no watermark or time limitRecord a tab, a window or your whole screen with your voice, for free: the tools built into Windows and macOS, and how to do it from the browser.